
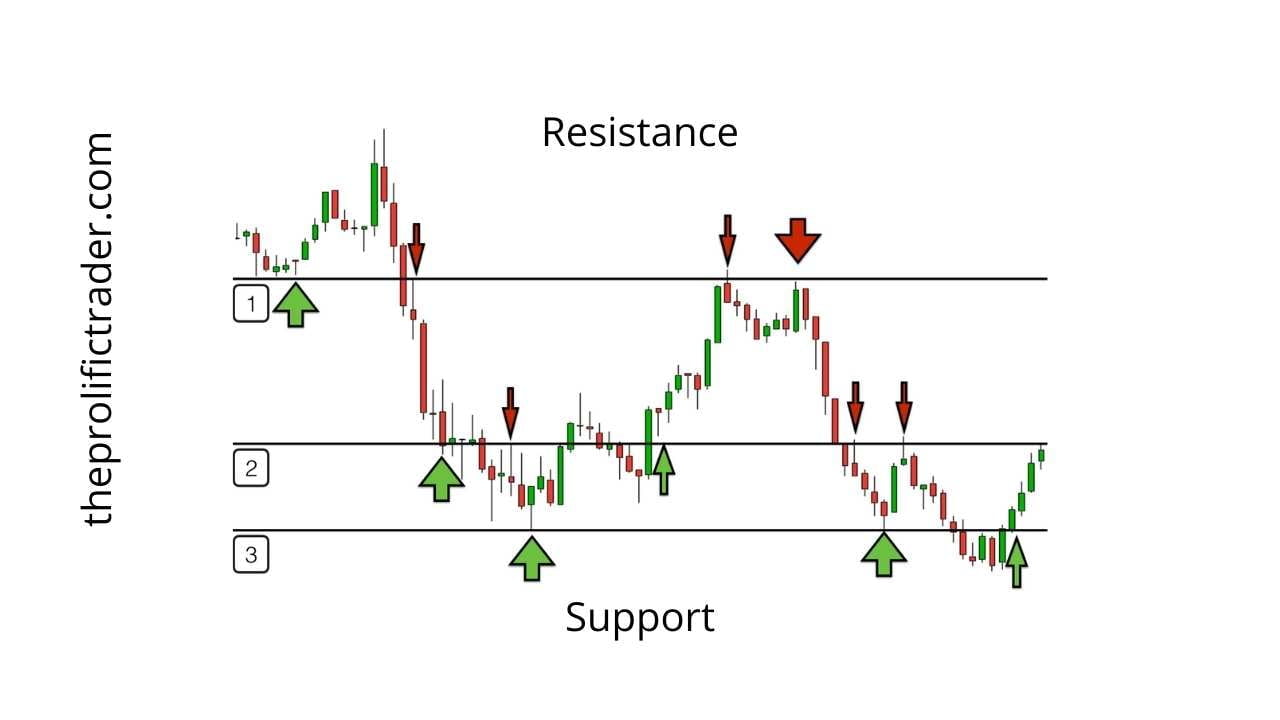

Support and resistance are not precise numbers. They refer to a price zone, as illustrated in the above graphic. There is more of a support and resistance zone to monitor than there is a specific price to track. A price area’s support or resistance level has both the upside and downside multiple times. The longer a chart remains within a price range, the more legitimate the sections become. Additionally, the wider the price range, the stronger the final break-out can be.
Oftentimes, a trader will see an old resistance level become a new support level. An old support level becomes a new resistance level when people buy or sell at an old important price level.
Why To Use Support And Resistance
- Horizontal support and resistance zones on a chart are graphic methods. It helps in quantifying, recognizing, and tracking a trend on a chart by identifying price levels of interest.
- On a chart, These zones can also be vertical. It helps in indicating buying and selling interest at ascending or descending moving averages or trend lines.
- During uptrends, traders buy crashes and pullbacks to a critical short-term moving average or vertical trend line. In uptrends, traders sell rallies and enter movements higher at a critical above the vertical trend line.
- During downtrends, traders sell into rallies to a critical short-term moving average or vertical trend line above the general market movement. Descending support areas occur during downtrends as traders buy sell-offs into swings lower to a critical vertical trend line of support.
Where to find Them
Support price levels are established when purchasers agree on a price level at which they will buy the dip and then overcome the selling pressure on the chart to halt any further decline.
On a chart, resistance price levels help the sellers decide at which price level they will sell into a rally and then resist the buying pressure at that moment, thus halting the rally.