

If you want to make money, Bullish flags that are strong and tight and breakout to the upside are best. Complex head and shoulders top chart patterns that break down are also Profitable. These choices are based on a lot of study and backtesting price action on charts. These Top Profitable Chart Patterns Are:
Bull flag chart facts:
- For the bull flag, there must be a stronger trend and tighter prices for the flag.
- It is a continuation of the uptrend before the flag.
- At least 90% or more the price should increase in the two months or less before the flag price range starts.
- After a big rise in prices happens because of a consolidation price range pattern formation. The price range can look like a flag, a pennant, or just a stop in the price of something.
- Volume should go down as the price range in the flag starts to shape up a little.
- The ‘pole’ is the previous uptrend that happened before a price consolidation.
- The “flag” is a rectangular price range that goes down after the uptrend to new higher prices comes to an end. The flag has mostly low highs and low lows.
Example
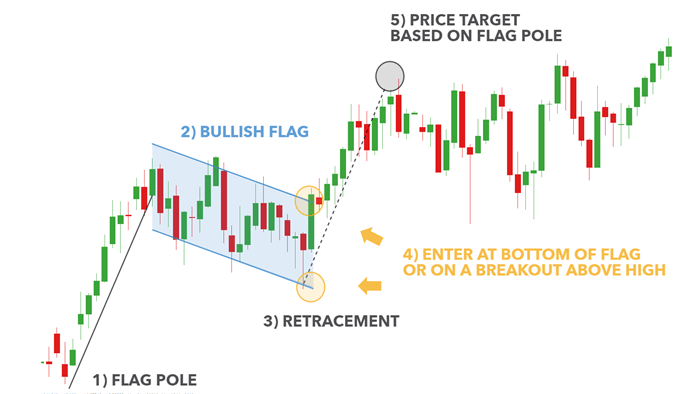
- When the end of the flag pattern comes to an end, there is a starting of upper trend with an upward move in price.
- This pattern is the consolidation for the uptrend.
- In the past, it was thought that the move out of the flag could be as big as the uptrend before the flag started.
- There is a sign that a pattern has been completed when the price closes above its highest point. This is almost always the peak of the flag.
- A breakout of the flag with more than normal volume makes it more likely that the uptrend will keep going.
- After you enter the flag, you can set a stop loss at the lower trend line in the flag.
Bull flag Top Profitable Chart Patterns Chart Pattern work?
It’s true that this pattern doesn’t work every time. When it does, it can set up a huge win, but with all set ups. Most of the advantage comes from having a good risk-to-reward ratio through a stop loss and a trailing stop.
Facts About Complex Head and Shoulders Top Chart Pattern:
This is a very complicated chart pattern with a lot of information:
- Complex head and shoulders is a different kind of head and shoulders chart pattern because it can have more than one shoulder or head when it is making.
- It is a pattern that shows when an uptrend ends. The pattern is formed during a bull market or when a chart is moving up. When this pattern is finished, it is usually a signal for a pullback, correction, or even a bear market. This pattern can only be valid if there has been an uptrend in the past.
- A head and shoulders top with a lot of parts can have a lot of shoulders or many heads, but almost never both.
- There should be at least two shoulders with tops that are about the same price, and they should be about the same distance from the head. They should also have the same shape, whether wide or narrow, when compared to their counterparts in the pattern.
- This pattern can have four to six price peaks, with the middle higher peaks making one or more “heads” and each smaller peak being a “shoulder.” The low of support that makes the valleys between the peaks is used to show the horizontal support, which is called the “neckline.”
- A lot of times, the left side of the chart pattern has more of this pattern.
- When the neckline support line goes down, it’s a good time to sell or sell short.
- The left shoulder or shoulders are formed during the first rise in the trend. When prices start to fall, they pull back to a level of support.
Example Chart
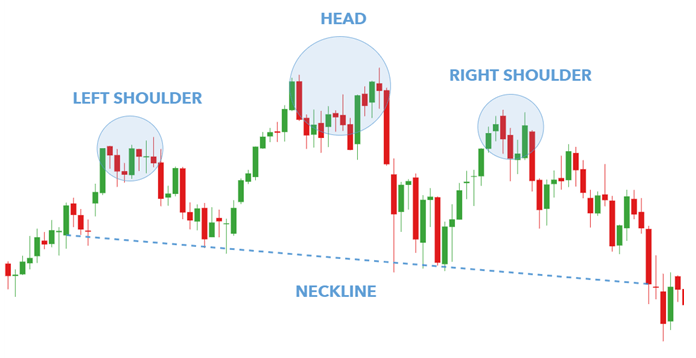
- Another rise in price goes higher than the left shoulder and breaks out to a new high, but it swings back down to the same price as the previous low.
- The third swing up in price is lower than the middle peaks that are the “heads” or “heads.” It is also the same size as the first high in price that made the left shoulder. The price then swings lower for the third time, this time near the two areas of support that were there the first time it went down.
- In this pattern, three to six swing backs to low price support should be similar so that a horizontal support line can be drawn. This line is called the neckline. Flat: This line can be very flat or it can go up or down. Another sign that the uptrend is coming to an end is when the neckline starts to go down.
- This trend should show less volume on the top of the head and shoulders and more volume as it swings down after each peak to show more distribution.
- Breaking the neckline of the pattern isn’t enough to make sure that the pattern is correct. There are many times when the old support at the neckline turns into a new barrier as price tries to get back up after a fall. This happens a lot. The more people who bought or sold when the price broke below the neckline, the more evidence there is that there could be a downtrend.
- People often compare how far they move down to how far they move up when they make a pattern called “head and shoulders.”
- We found the normal head and shoulders top to be the second most successful bearish chart pattern. We can use both to take profits.
Head and Shoulders top Chart Pattern work?
This pattern doesn’t work every time, but when it does, it can set up a huge victory to the downside. With all setups, much of the advantage comes from having a good risk-to-reward ratio by setting a stop loss and a trailing stop.
Good Luck Traders. Thanks for reading ”Top Profitable Chart Patterns”.
Also Read
12 Reasons Most Of Traders Never Make Money